Tracking Result with Lineage Graph
To improve the traceability of the Capturing Results type dataset, users can open a lineage graph to find out how the results were generated and whether they are reproducible.
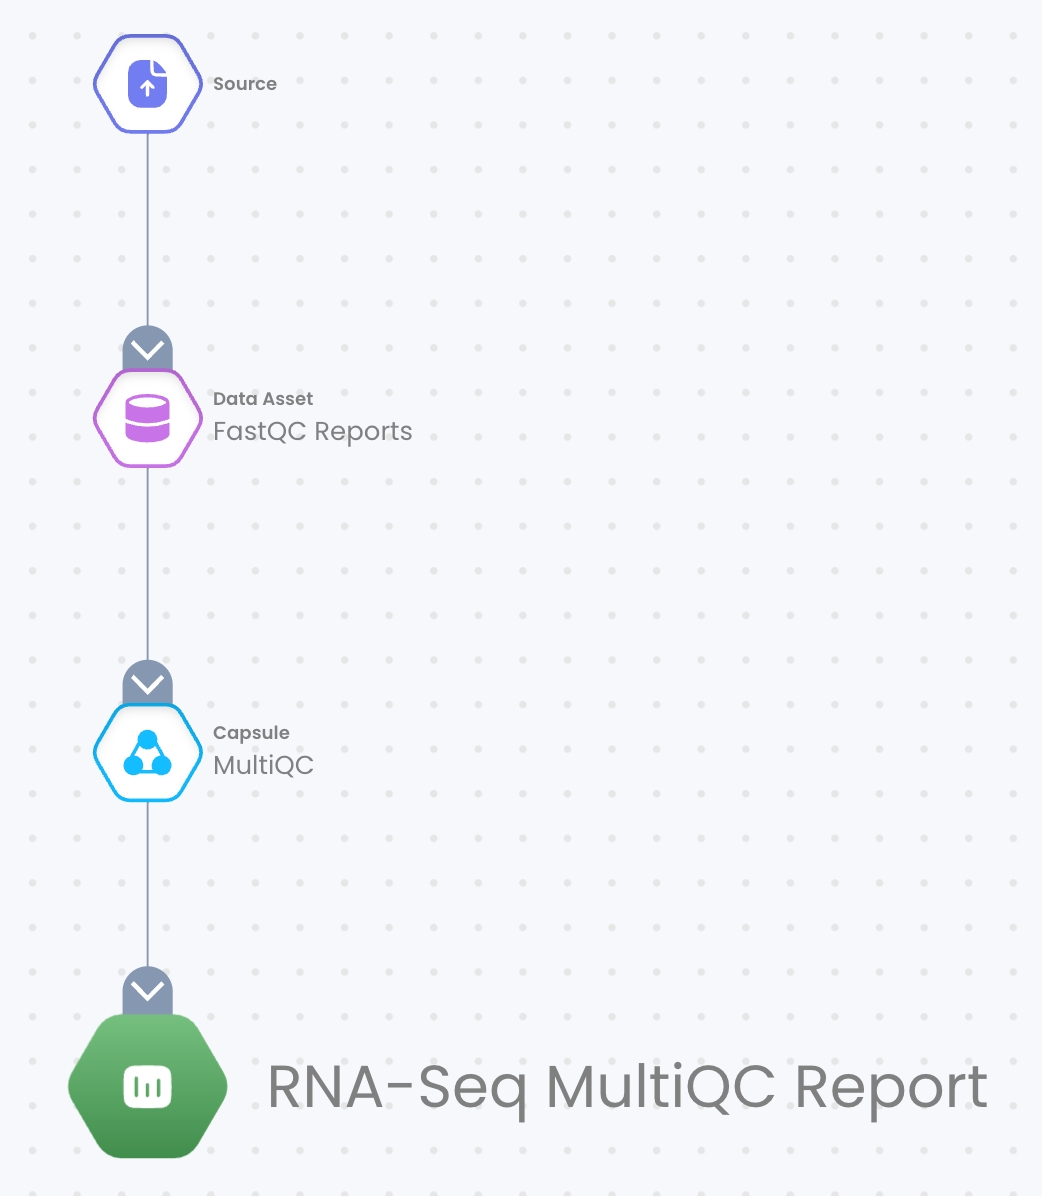
In the graph, you can see which capsules, pipelines and data were used to produce a particular Results data asset. The color coding shows you if/how the final Results can be reproduced, and if a data asset can’t be reproduced, you’ll see exactly which step of the process or requisite data are no longer available.
Color Coding
Green: The capsule/pipeline and the dataset required are versioned and kept on the platform and it is fully reproducible.
Red: part of the component is missing for reproducing the Results dataset. You can hover over the Results and see why it's no longer reproducible on the platform.
Last updated