RNASeq Quantification Pipeline
This RNASeq Pipeline aligns sequencing reads (single or paired end), sorts and indexes the alignment (.bam), counts features and conducts a differential gene expression analysis.
The pipeline uses the following four Apps Library Capsules
STAR Alignment
Sambamba Sort & Index
FeatureCounts
DESeq2
Creating Prerequisite Data Assets
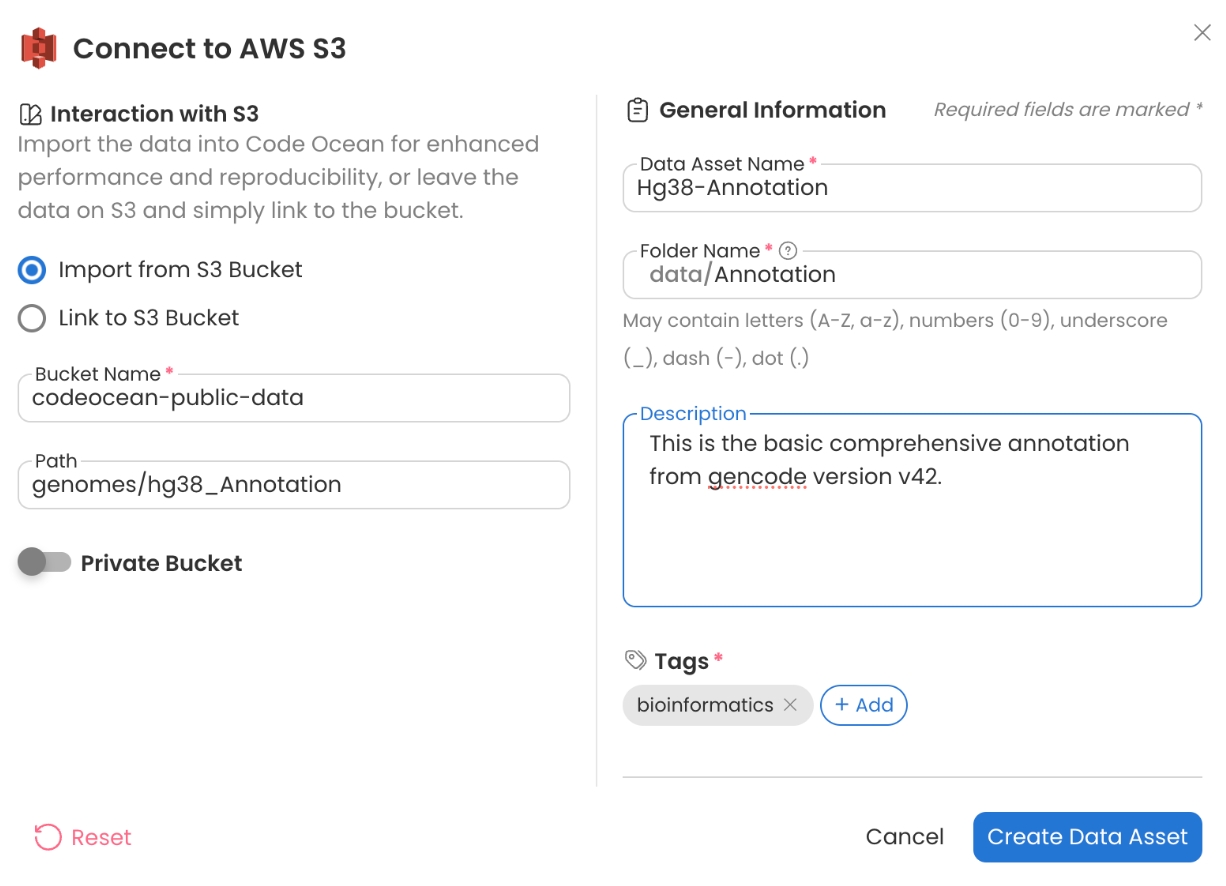
Code Ocean has supplied the datasets needed to run the Pipeline on the codeocean-public-data S3 bucket. Create a Data Asset from the public S3 bucket below. For more details, see Adding a New Data Asset.
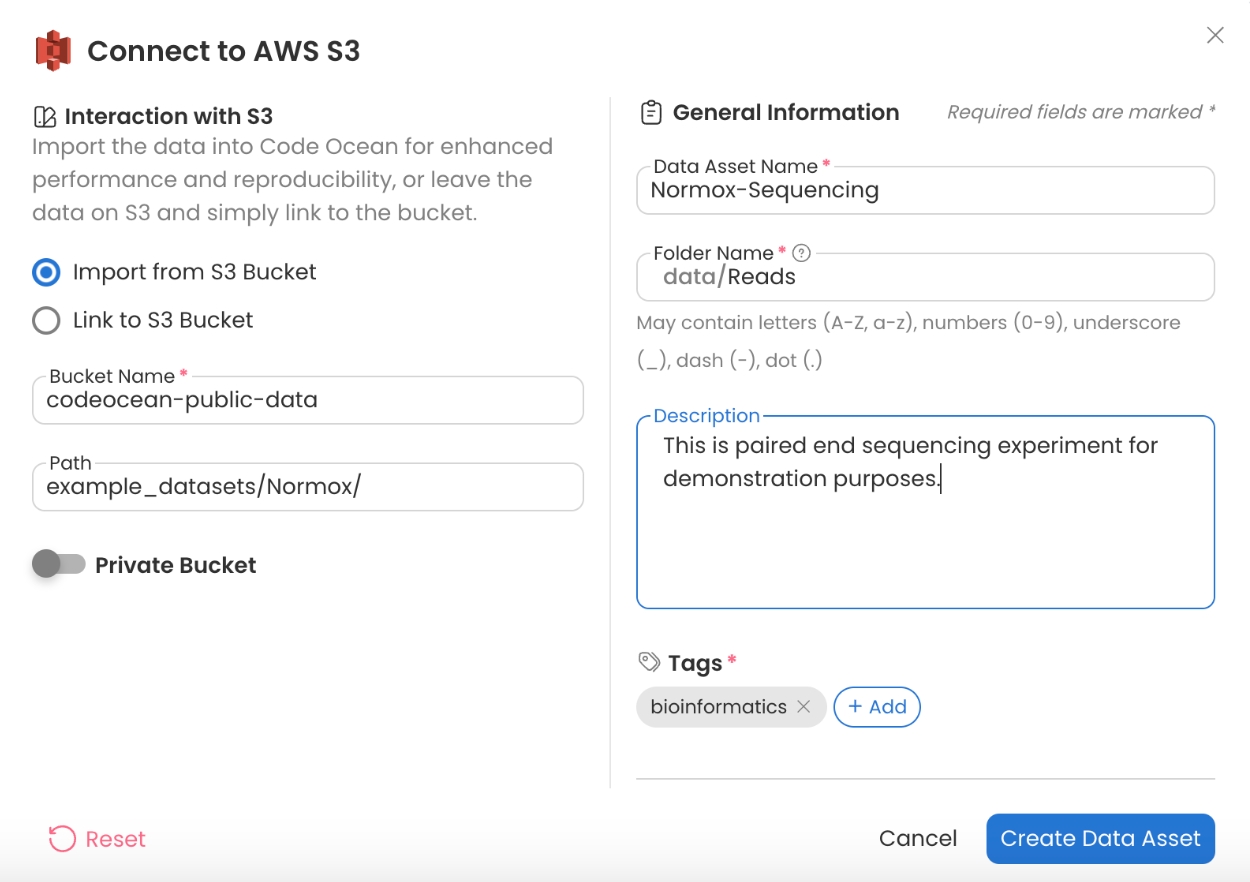
Example Sequencing Reads
Bucket Name: codeocean-public-data
Path: example_datasets/Normox
In this example dataset containing reads from different samples, all reads for each sample will be in a separate folder. The Pipeline will pass each folder to the downstream alignment, allowing each sample to process in parallel.
hg38 Annotation
Bucket Name - codeocean-public-data
Path - genomes/hg38_Annotation
Here, we assume the reads are aligning to hg38, but any reference can be used.
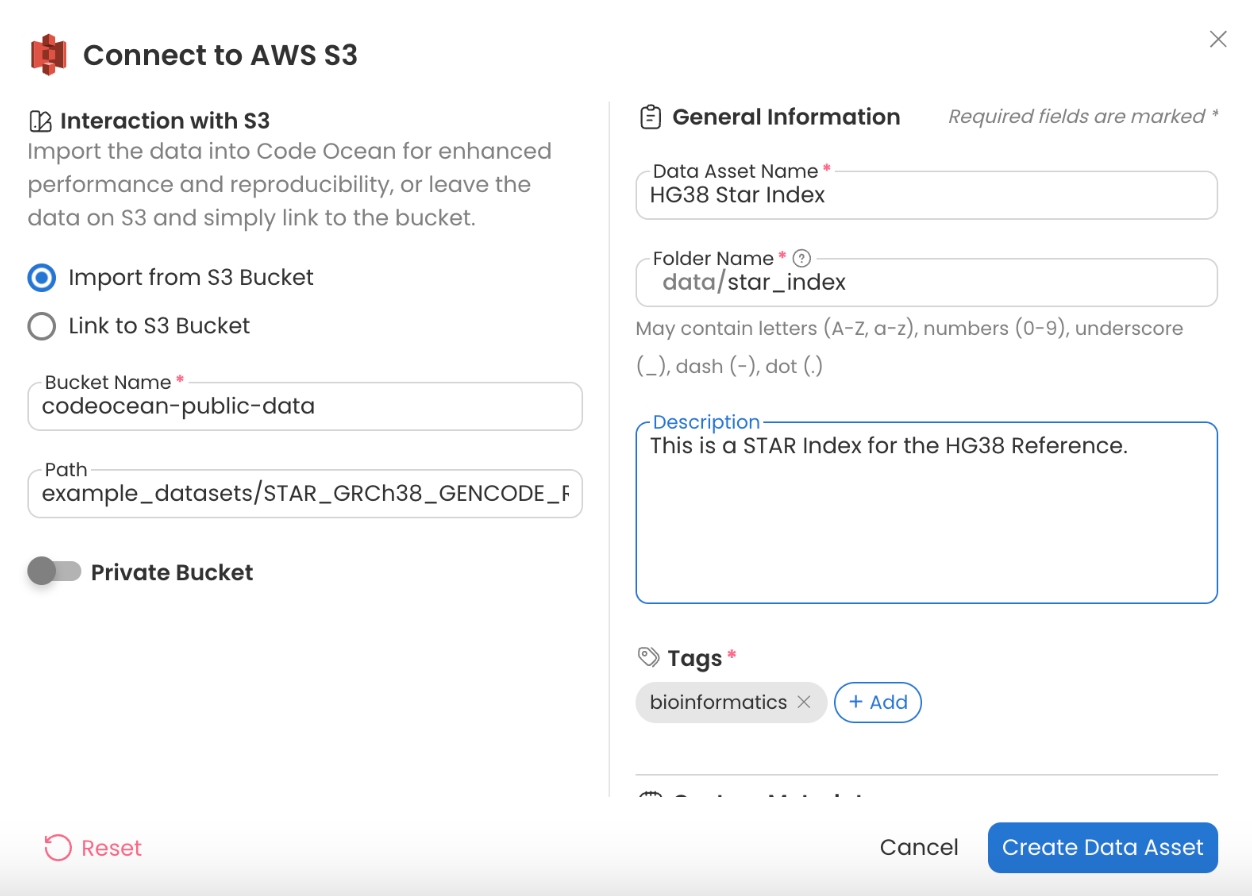
hg38 Star Index
Bucket Name - codeocean-public-data
Path - example_datasets/STAR_GRCh38_GENCODE_Release_21_Index/star_index/
In order to create a reference for a different genome, visit the STAR Generate Genome Index Capsule in the Apps Library and follow the README in order to create a compatible index for STAR.
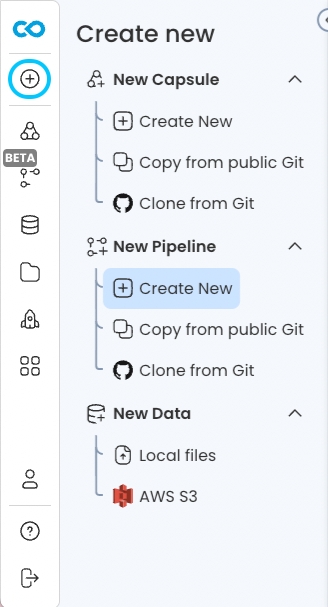
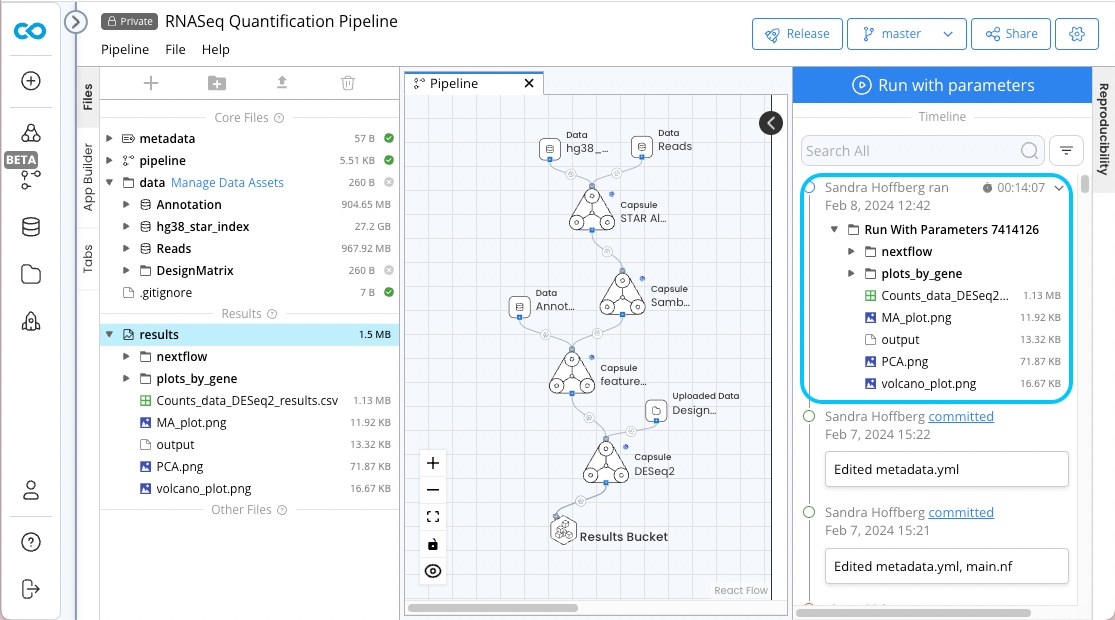
Create a Pipeline
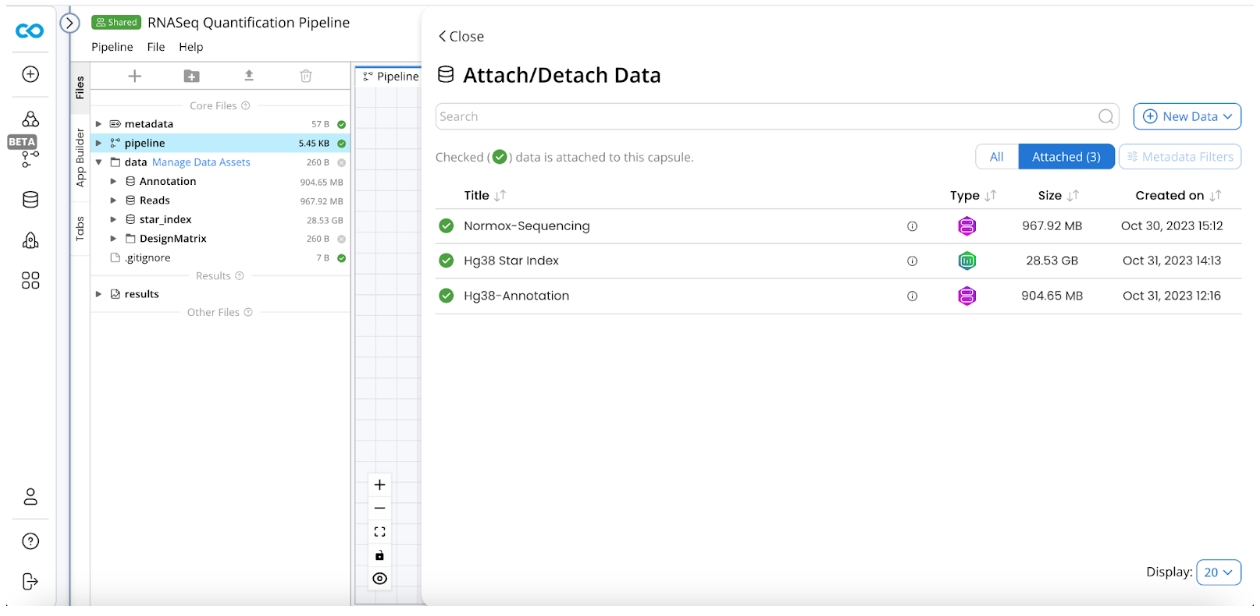
Attach Data Assets
Click Manage Data Assets
Attach STAR Index, Annotation, and Example Sequencing Reads Data Assets.
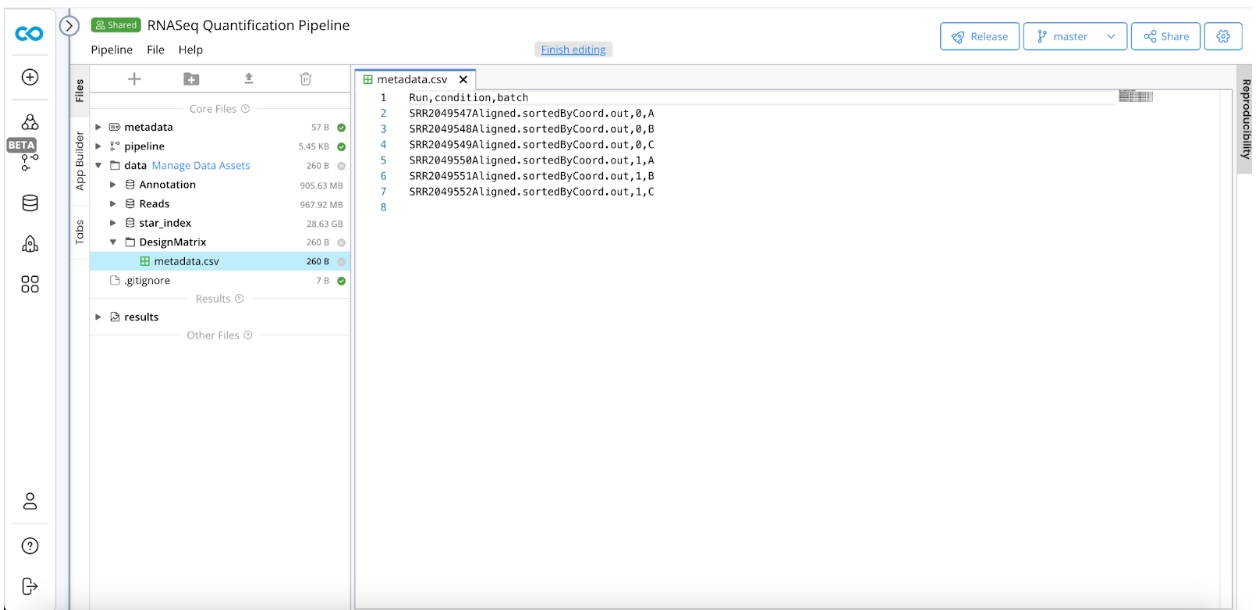
Design Matrix
The design matrix specifies metadata associated with the samples, i.e. tumor vs normal, tissue type, etc. In order to create the design matrix:
Create a Folder named DesignMatrix
Create
metadata.csvwith the following 3 columns:Run
Condition
Batch
Run should match the prefix for the .bam file output for the sample. Condition and Batch should indicate any metadata conditions to take into account to differentiate the samples in DESeq2.
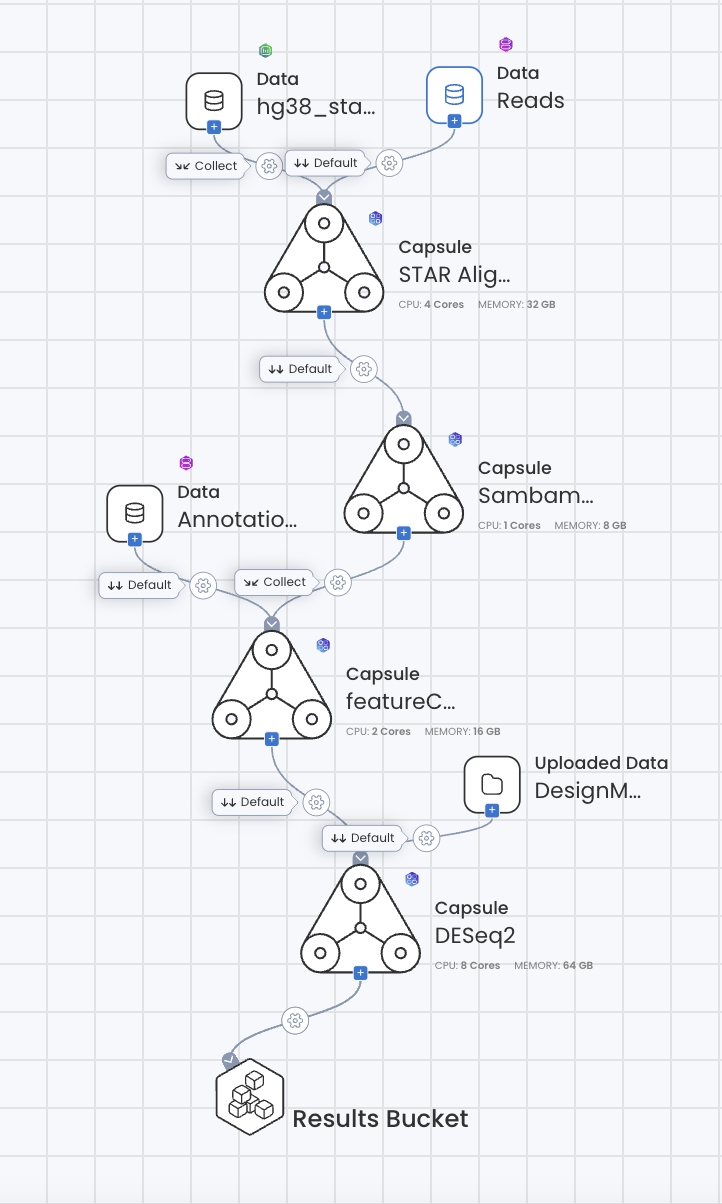
Assemble Pipeline
Add the following Code Ocean Apps Capsules to the Pipeline Builder area:
STAR Alignment
Sambamba Sort & Index
FeatureCounts
DESeq2
Configure Connections
In order to configure the connection for each step:
Reads Dataset to STAR Alignment is set to Default.
HG38 Star Index to STAR Alignment is set to Collect.
STAR Alignment to Sambamba Sort & Index is set to Default
Sambamba Sort & Index to FeatureCounts is set to Collect
Annotation Data Asset to FeatureCounts is set to Default
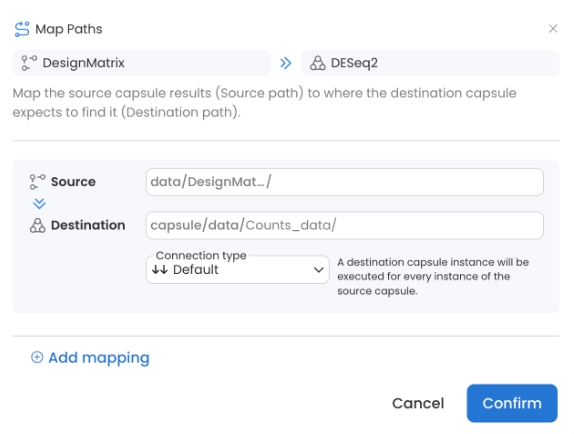
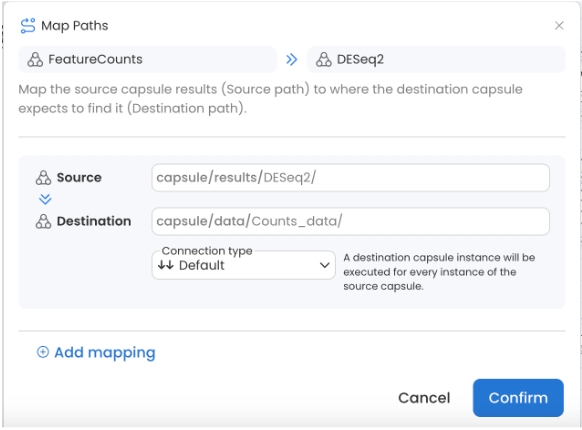
FeatureCounts to DESeq2 is set to Default
Set the destination to Counts_data
Create and attach DesignMatrix -
metadata.csvto DESeq2.Select Connection to Default, set the destination to Counts_data
Completed Pipeline
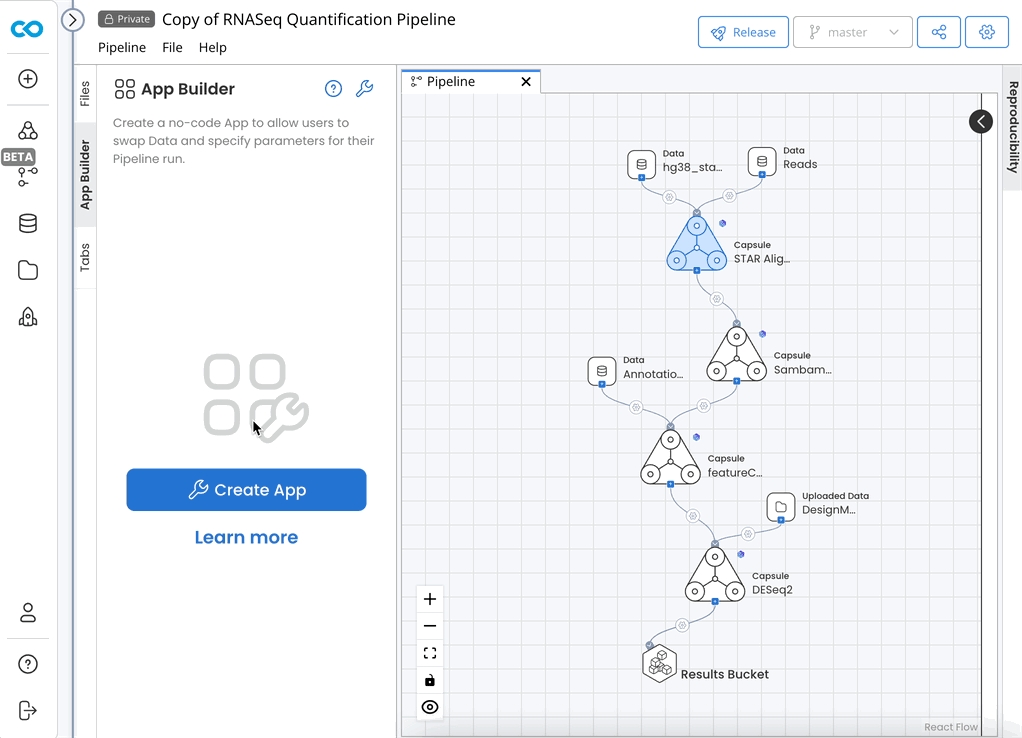
Configure App Panel
On the App Builder tab, click Create App. Click Create App again if prompted. Click Finish.
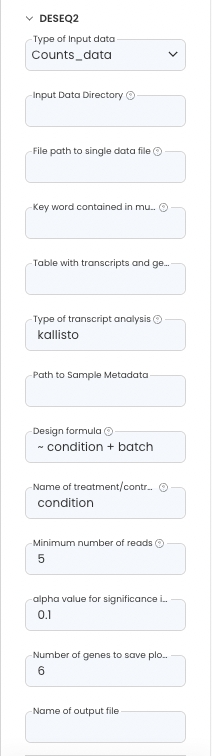
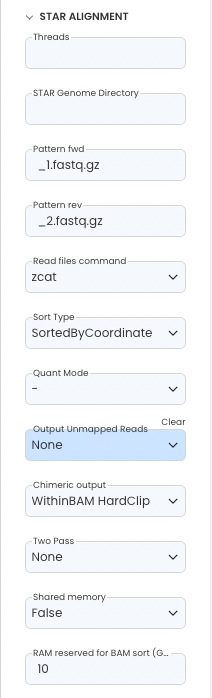
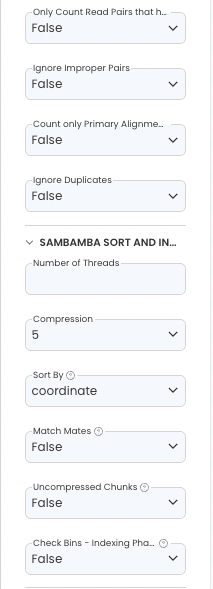
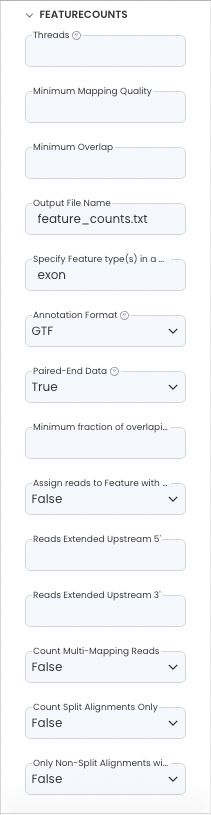
Parameters
Configure the App Panel as follows.
Reference READMEs in Capsules to find out more about the parameters used.
The DESeq2 “Design formula” is based on the columns supplied in the design matrix.
Results
nextflow
Consists of logs describing actions of nextflow.
DESeq2_results.csv
.csv file with the results table
MA_plot.png
MA plots display a log ratio (M) vs an average (A) in order to visualize the differences between two groups. In general we would expect the expression of genes to remain consistent between conditions and so the MA plot should be similar to the shape of a trumpet with most points residing on a y intercept of 0.
PCA.png
Visualize how the samples group by treatment
volcano_plot.png
The volcano plot enables it to simultaneously capture the effect size and significance of each tested gene.
plots_by_gene
A folder containing a file for each gene that plots the normalized counts for a single gene in order to get an idea of what is occurring for that gene across the sample cohort.