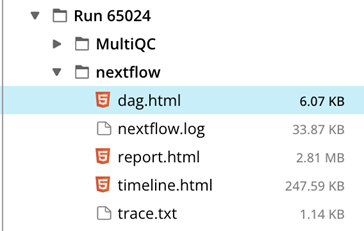
The Nextflow Folder
After a Pipeline run is completed, Nextflow produces a set of logs and reports. They contain information about the execution of the Pipeline and can serve as a helpful resource for debugging.
The files are the following:
dag.html - a direct acyclic graph (DAG) visualization of your Pipeline, where the vertices are the Capsule job names and the edges are the data transfer channel names.
netflow.log - text file with detailed information about the execution of the Pipeline. This is one of the most comprehensive files and the best place to find specific technical errors that caused a Pipeline to fail.
report.html - an HTML version of nextflow.log. This report has the sections Summary, Resources, and Tasks. The Summary section reports the execution status, the launch command, overall execution time and some other workflow metadata. The Resources section plots the distribution of resource usage for CPU, memory, job duration and disk I/O for each workflow process. They have two or three tabs with the raw values and a percentage representation showing what proportion of the requested resources were used. These plots are helpful to check that task resources are used efficiently. The Tasks section lists all executed tasks, reporting for each of them the status, the actual command script, and many other metrics.
trace.txt - useful information about each process executed in your pipeline script, including run status of each job
| Field | Information provided |
|---|---|
Task_id | Task ID. |
Hash | Task hash code. |
Native_id | Task ID given by the underlying execution system e.g. POSIX process PID when executed locally, job ID when executed by a grid engine, etc. |
Name | Task name |
Status | Task status. Possible values are: COMPLETED, FAILED, and ABORTED. |
Exit | POSIX process exit status. |
Submit | Timestamp when the task has been submitted. |
Duration | Time elapsed to complete since the submission. |
Realtime | Task execution time i.e. delta between completion and start timestamp. |
%cpu | Percentage of CPU used by the process. |
Peak_rss | Peak of real memory. |
Peak_vmem | Peak of virtual memory. |
Rchar | Number of bytes the process read, using any read-like system call from files, pipes, tty, etc. |
Wchar | Number of bytes the process wrote, using any write-like system call. |
timeline.html - an HTML timeline with a bar for each process executed in your Pipeline. As each process can spawn many tasks, colors are used to identify those tasks belonging to the same process. The bar length represents the task duration time (wall-time). The colored area in each bar represents the real execution time. The grey area to the left of the colored area represents the task scheduling wait time. The grey area to the right of the colored area represents the task termination time (clean-up and file un-staging). The numbers on the x-axis represent the time in absolute units e.g. minutes, hours, etc. Each bar displays two numbers: the task duration time and the virtual memory size peak.